Future Fund is Australia’s sovereign wealth fund, responsible for investing and strengthening the Australian Government’s long-term financial position.
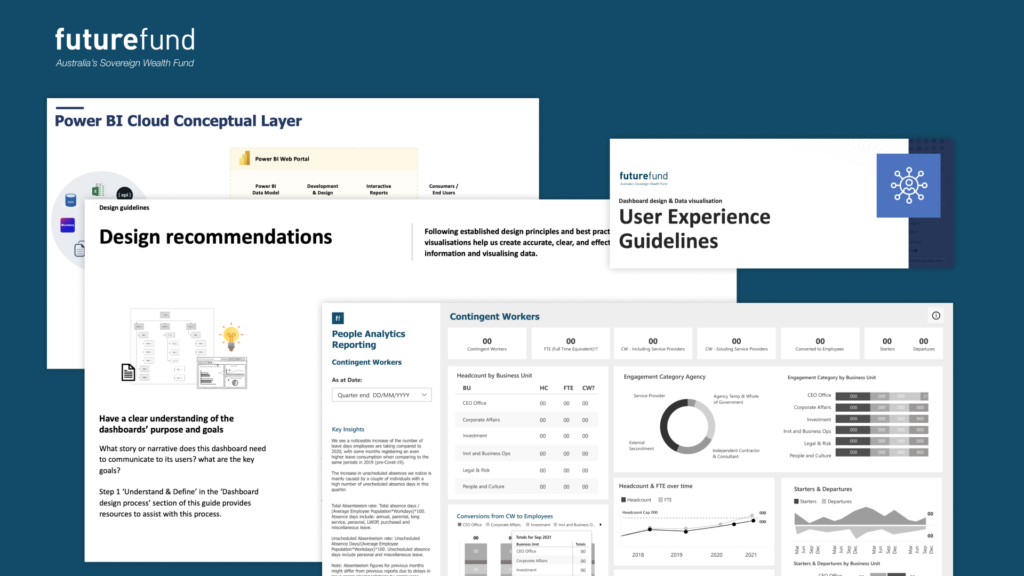
My involvement at Future Fund started with a 4-week engagement to demonstrate the value of introducing UX and UI design for a selection of new investment dashboards supporting the Visual Reporting Project, a new program of work to provide Investment Teams improved access to data, analytics, and visualisation capabilities using Microsoft Power BI.
My role as a senior UX Design consultant evolved to become part of a wider service offering across the organisation. Working in the Investment Technology and Delivery Platform team and in the BI centre of excellence providing best practices, governance, standards and processes across Visualisation and Business intelligence, and working on an ad-hoc basis for specific projects building data visualisations for different areas of the business.
Insights
- Dashboards provided an inconsistent and unintuitive experience for users
- Solutions produced with minimal end user input and consultation
- Usability issues in layouts, navigation, interactivity, and interface design
- Designs executed and developed as isolated projects without a holistic oversight
- Solutions built from scratch without reusable templates
- Growing demand for data visualisation across the agency
- A business wide need for governance, standards, processes, and guidelines
Process
- Discovery workshops, interviews
- Stakeholder management
- Business analysis and requirements gathering
- Identify user groups and needs, aligning business and user personas
- Cross-team collaboration to understand end to end CX and touchpoints
- Wireframes, prototypes, User Interface design
- Usability testing, design feedback & validation
Outcomes
- Enhanced Collaboration with stakeholders and developers in defining and delivering data visualisation solutions
- Providing value upfront by visualising and prototyping solutions before other resources are engaged
- Development of design frameworks and component libraries to ensure consistency and improve usability and interface design
- Growing awareness of the value of data visualisation and how it can help different business areas
- Alignment to agile project delivery and technical standards
- Transitioning from Power BI on Premise to PowerBI in the cloud
- Applying tool-agnostic standards as new technologies are adopted (Python, dash, plotly)


